Data Analysis: Group Stage Summary – 07.12.2018
Aim of this article is to reflect on what we have seen during matches in elite groups A and B. And yeah, use some data on the way.
Right from the start it is very important to note few contextual facts:
Two games were not tracked with data (Germany vs Latvia and Denmark vs Norway). This makes it much tougher to evaluate Germany, Latvia and in particularly Denmark and Norway as only games against strong opponents were tracked for them.
Data sample is very small. Some players had no or limited minutes in some matches and their numbers are therefore influenced by that. To account for this size of flags in player´s graph are in place. Smaller flag means smaller sample size.
Overall quality gap between teams is still too big in floorball for it to be able to compare teams via numbers of relevant metrics.
Next table is focusing on selected Key Performance Indicators (KPI). These were selected based on hypothesis from previous floorball data research (1, 2, 3) and are discussed further below.
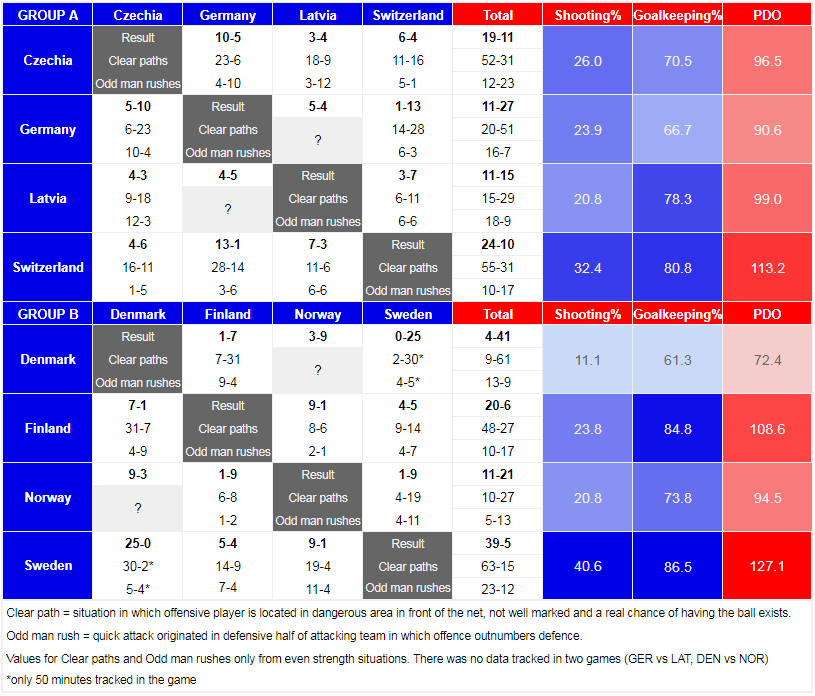
Other than results there are clear paths and odd man rushes counted for each game. Them together create a base for measuring dangerous possessions. They also give information on playing styles and strong parts of each team´s game. Three right columns stand for shooting percentage, goalkeeping save percentage and PDO that is calculated by simply summing both of these percentages.
Historic champions tend to have strong PDO and after group stage Sweden dominates with 127.1 followed by Switzerland with 113.2 and Finland with 108.6. Group A winner Czechia with only 96.5 must up its efficiency in order to succeed further in play-offs.
Next data results in the article work with possessions in games. Following table is looking at teams and their specifics and performance in the group stage.
Top 4 teams liked to create pressure on their opponents (very right column) but also Germany did not shy away from pressuring. Top 4 was also the most patient when attacking with the most share of slow attack possessions. Norway elected slow attacks too in a fair share. At the same time they were the team with the most quick attack possession share. Denmark created the biggest share of odd man rushes, Czech team was able to force most turnover possessions.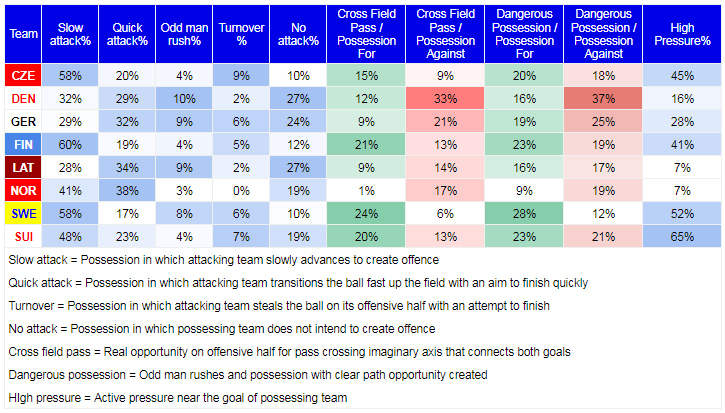
Shifting to quality of possessions cross field passes and dangerous possessions are of our interest. Sweden was able to create cross field pass opportunities on 24% of their possessions. They were also the strongest in preventing cross field passes with only 6% of possessions with them against. Again Sweden dominates dangerous possessions both for and against. Finland and Switzerland then created a good share of 23% of possessions with clear path opportunity for. Latvia was second best in preventing possessions with clear path opportunities against with 17%.
Look at players now. They are categorized to four graphs below with always two teams selected as being together according to obvious similarities.
Both Denmark and Norway played against strong Swedish and Finnish teams and so their numbers reflect that.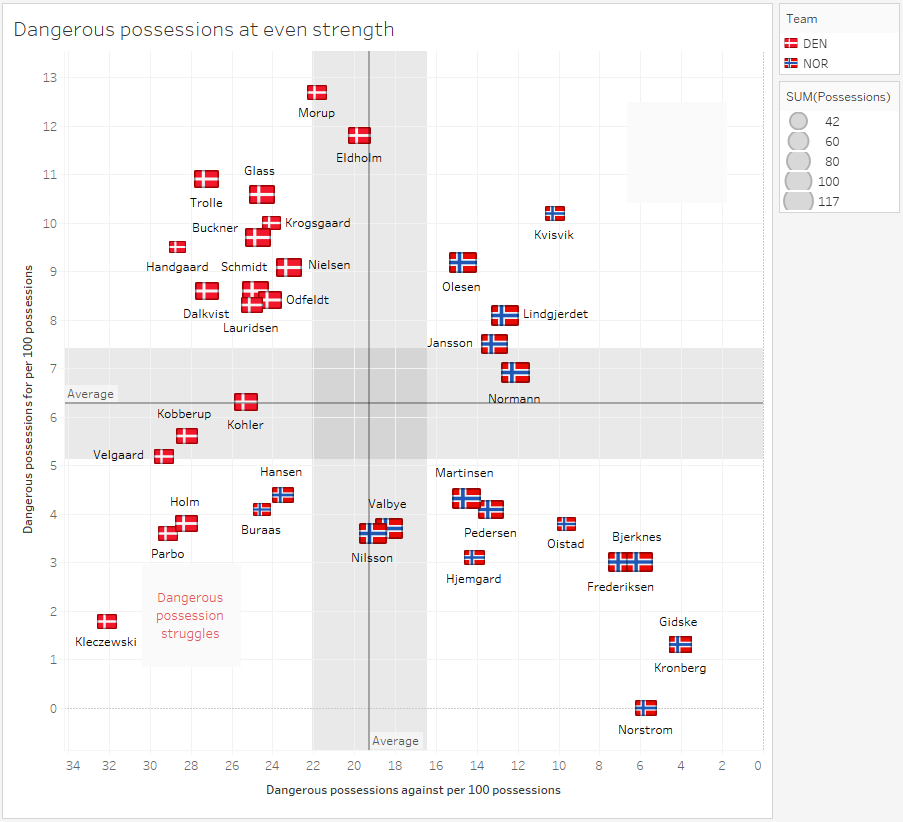
For Denmark Morup and Eldholm had respectable results of dangerous possessions when on the field. Norwegian Kvisvik or Olesen, Lindgjerdet who played more deserve some praise for their solid numbers.
Game is a thing of teammates, opponents and lines work organically together. Therefore it would be too silly to take all these results as a dogmatic fact rather than indicator of a current display on the field.
We move on to Germany and Latvia that battled in group A.
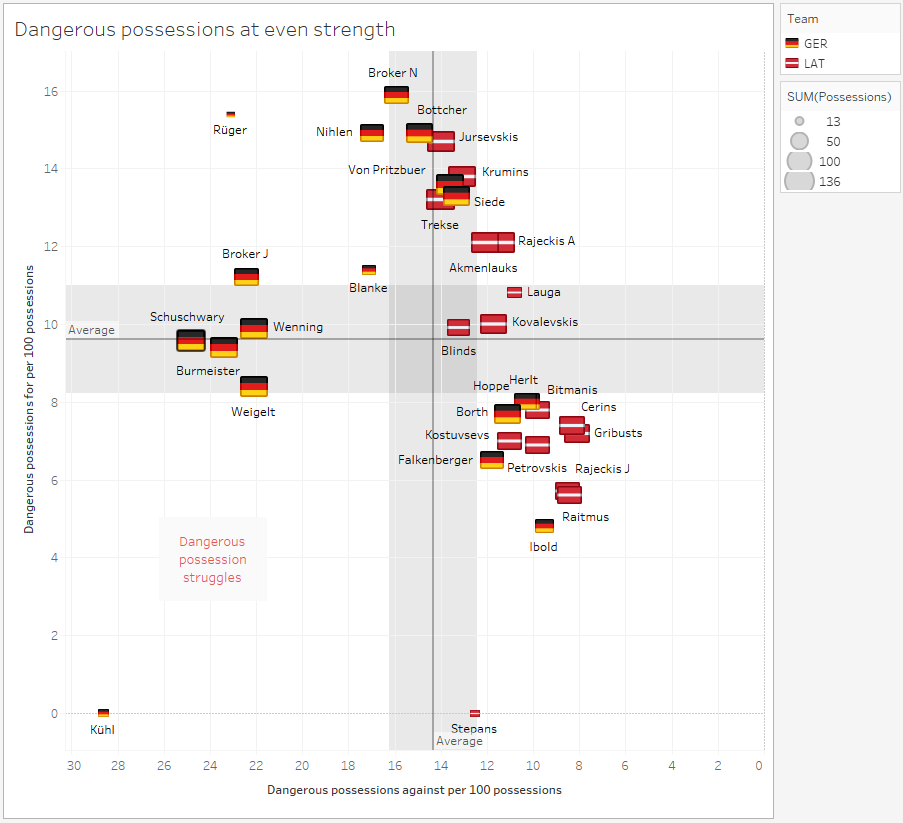
Data are from their games against Switzerland and Czechia. Some players were able to end up with positive results in dangerous possession metrics against strong opponents. Latvian Rajeckis A, Krumins and Jursevskis had best results for Latvia. Siede, Bottcher, Broker N and Von Pritzbuer did not dive to negative numbers themselves for Germany.
Host country Czechia and Switzerland battled for the first place in group A and we can look at how their players did in group stage.
Känzig jumps out in the graph as great in yielding dangerous possessions for. Small flag next to his name indicates that his sample size is limited and even against Czech team he played limited minutes. Swiss line Burki, Camenisch, Zaugg, Hartmann and Hofbauer leads the way for their team. Defenders Kisugite and Nemecek then recorded the best results for Czech side followed by forwards Benes and Jendrisak.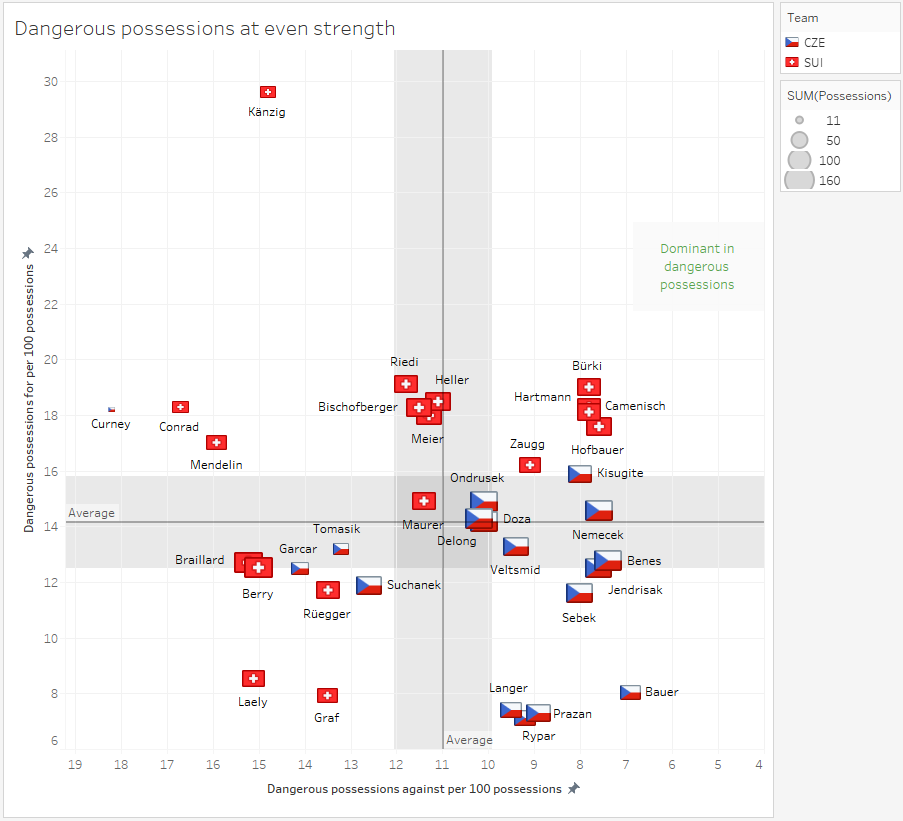
Sweden and Finland as last two teams are visualized in next graph.
Wilhelmsson did not play against Finland and probably enjoyed very much to be on field against weaker opponents later in group stage because his numbers are literally off the chart. All Swedish players ride strong numbers. It is a line with Lamminen, Savonen, Salin, Salo and Johansson S that dominates opponents the most for Finland so far.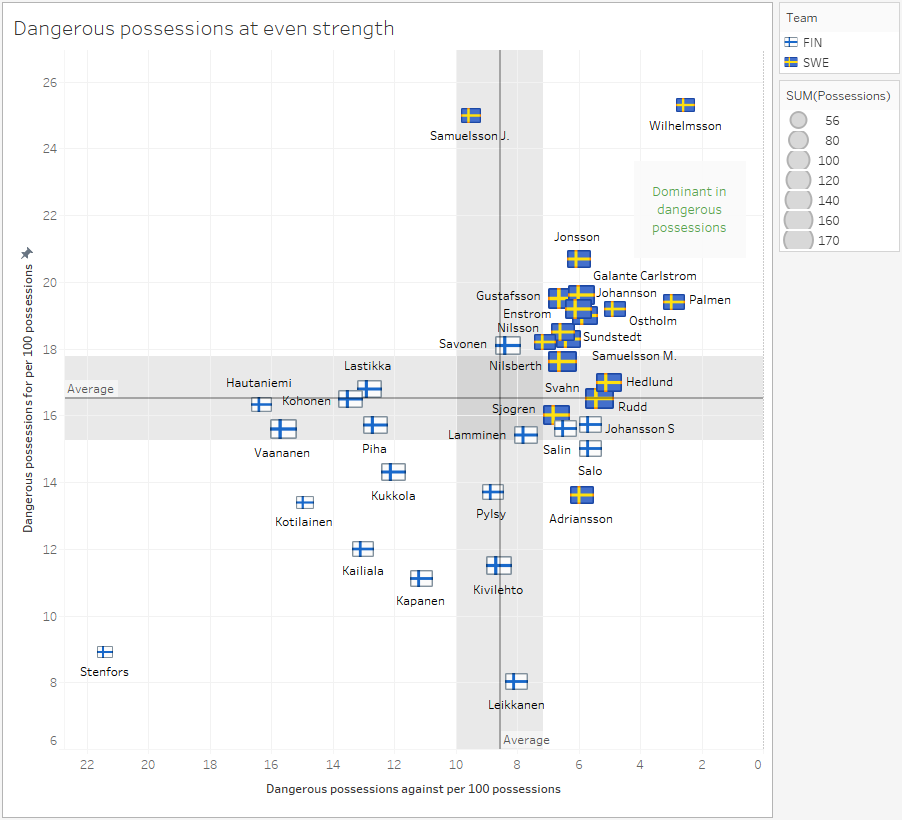
Significance of past games for contenders will diminish once play-off starts. Challengers will take their chance to surprise top 4 teams in quaterfinals and then we will see in a quick fashion who can really dominate and lead its team to glory.
By Petr Malina
News
21 - 40 / 146


Latvia Overcomes Norway after Penalty Shootout – 8.12.2018
Data Analysis: Czech Republic vs Denmark 10-1 – 8.12.2018
DAY 8: Battles for Final Start, Quarterfinal Losers to Fight for Fifth Place – 8.12.2018
Day 7 Summary: Favorites Sail through to Semis, Championship Again Offers Fantastic Atmosphere – 8.12.2018
Slovakia Takes 9th Place after Exciting Victory over Estonia – 7.12.2018
Finland Becomes Last Semifinalist after 6-1 Win against Germany – 7.12.2018
Canada Edges out Australia Thanks to Huge Comeback in Third Period – 7.12.2018
Sweden Advances to Semifinals after Beating Latvia – 7.12.2018
Poland Outclasses Thailand 9-1 to Grab 13th Place – 7.12.2018
Takizawa Scores Twice as Japan Beats Singapore 4-2 to Take 15th Place – 7.12.2018
Data Analysis: Group Stage Summary – 7.12.2018
DAY 7: Two Quarterfinals and Final Placement Matches on Schedule – 7.12.2018
Day 6 Summary: Czechs Easily through, Switzerland Stumbles, Attendance Record Broken – 7.12.2018
New WFC Attendance record – 6.12.2018
Data Analysis: Sweden vs Denmark 25-0 – 6.12.2018
Czech Republic Comfortably Wins Over Denmark to Reach Semifinals – 6.12.2018
Estonia Outclasses Canada 9-2 to Face Slovakia in 9th Place Game – 6.12.2018
Switzerland Gets Past Norway in Overtime Drama – 6.12.2018
Slovakia Beats Australia 12-3, Will Fight for 9th Place Tomorrow – 6.12.2018
Data Analysis: Norway vs Finland 1-9 – 6.12.2018