Data Analysis: Overview of the EFT in Pardubice – 07.09.2018
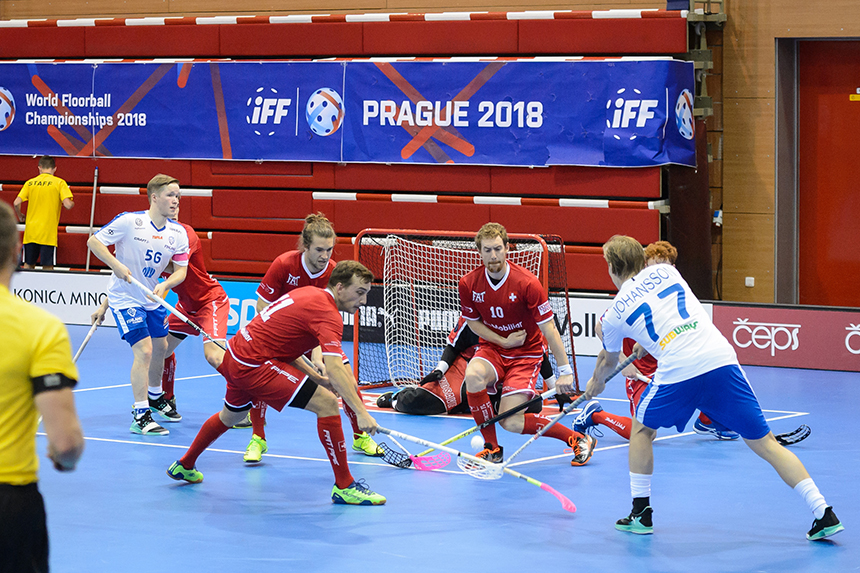
We already brought you data analysis from men Euro floorball tour games played in Pardubice. Now it´s time to summarize the tournament from the data perspective.
The focus in data collection was measuring quantity and quality of possessions. Distinguished are four different types of possessions: Slow attack, quick attack, turnover and no attack. See definitions in our first data game analysis here.
Quality aspect was brought by observing clear path opportunities, cross field pass opportunities and odd man rushes. Again definitions to be found in the article with the link above.
GAME ANALYSIS: Possession quality matters
Despite small sample size all quality possession measures seems to be justified.
A goal was scored on 11% of possession that included clear path opportunity. Only 2% possessions yielded a goal when there was no clear path opportunity recorded.
7% of possessions that included cross field pass opportunity ended up with a goal. 3,5% of possessions ended up with a goal when there was no cross field pass opportunity in the play.
Possessions that included odd man rush yielded 8% of goals scored from them. With no odd man rush only 2% of possessions resulted in a goal scored.
This corresponds to a hypothesis and explains the reasoning behind why to track these quality measures.
On top of this, quick attacks and turnover possessions are supposed to be the ones of best quality (to know why read this article). During three EFT games it was recorded that turnover possessions yielded the most clear path opportunities (41% vs 34% from quick attacks and 24% from slow attacks) and quick attacks yielded the most odd man rushes (38% vs 25% from turnovers and 2% from slow attacks). Nevertheless during the EFT teams were successful to score with higher shooting efficiency from slow attacks so there are no big differences between every type of possession plays (and again the sample size is very small): 5,9% goals from quick attacks, 4,5% from turnovers, 4,1% from slow attacks and of course 0% from no attack.
TEAM ANALYSIS: 1. Switzerland, 2. Finlad, 3. Czech Republic
Each team won a game in the tournament and based only on goal differentials we would see this final ranking: 1. Finland (+2), 2. Switzerland (+1), 3. Czech Republic (-3). But analyzing the even strength data I would had to rather incline to the ranking stated in the title. Let me explain why.
We now know that possessions with clear path opportunities can be very dangerous. Switzerland was the team with best clear path differential.
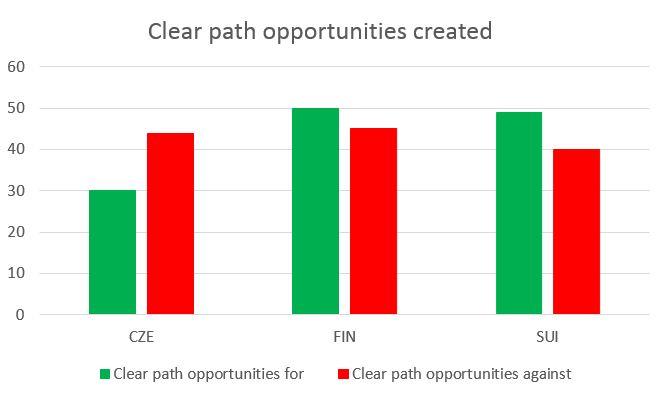
Finland created the most clear path opportunities (50) at even strength but was also prone to giving them up (45) and that created differential of +5. Switzerland recorded the best differential of +9. That leaves the Czech team with a negative -14.
Alright, to have that clear path opportunity is only the first part of having a good scoring chance. Sometimes you struggle to execute these opportunities. How often were teams able to execute these clear paths? Look at following graph.
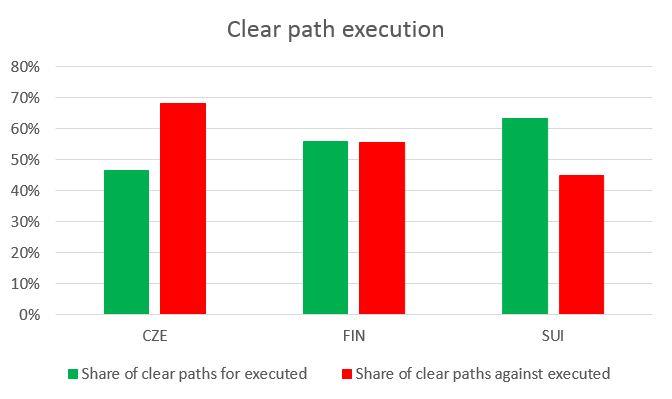
Switzerland not only created the best clear path opportunity differential but were also the best in executing these plays. There were able to yield and execute clear paths on 63% of occassions. On the other hand, their opponents struggled with execution of clear paths (only 45%). Again the Czech team was worst in this comparison as well. Summing up for clear paths, we see very clear picture in which Swiss team was a dominant one, Finland was second and Czechs could not match numbers of these two.
Another area of interest to study were odd man rushes.
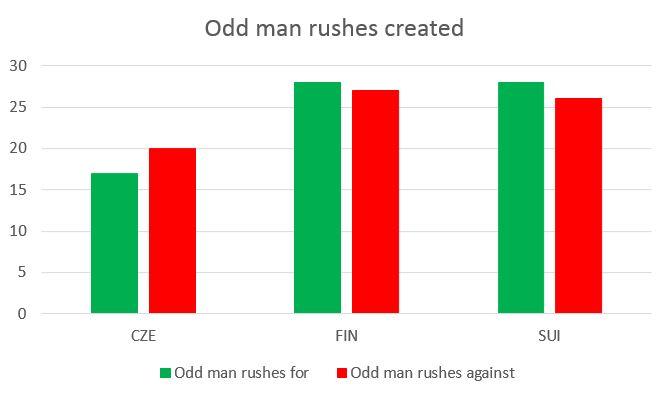
Both Finland and Switzerland were active in these situations and recording slightly positive differential. Czech team was much more cautious and not many odd man rushes were created when they played. At least they kept the number low for odd man rushes against and so they could compete in this regard.
Last graph for team´s comparison focuses on cross field pass opportunities. These sitauations do not have to be always dangerous but it was proved that you are more likely to score with cross field pass opportunity than without.
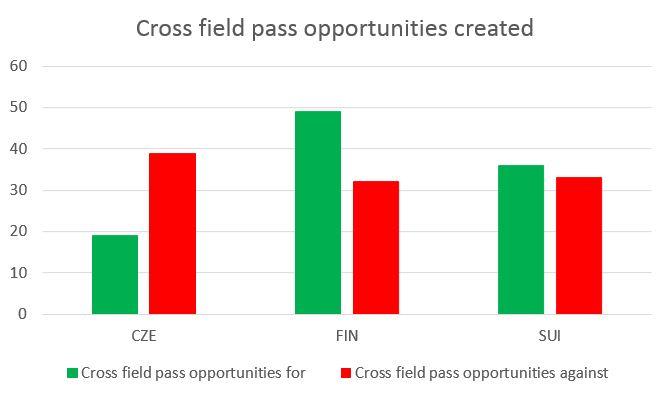
Here, Finland was the dominant team that used this play much more often than their opponents. Again the Czech republic could not catch up in this aspect of the game. Not many good news for the Czech team but there is a but so don´t worry that much.
This but comes from studying all players performing at the tournament. Again, possession quality measures such as clear paths, cross field passes and odd man rushes were these of interest. Look at correlations between these measures acorss all players.
Clear path opportunities and Cross field pass opportunities = 0,67
Cross field pass opportunities and Odd man rushes = 0,36
Clear path opportunities and Odd man rushes = 0,50
It is clear that these variables are positively correlated. If a player (and possibly a team) records positive result in one variable he will likely have a positive result in the other one. Therefore it is problematic to evaluate both players and team as well in these categories separately. Because one influnces the other one. So Czechs if you fix one issue you can fix it all, right?
PLAYER ANALYSIS: Why so serious? Don´t be just yet
For players, let´s start with looking at who was the most often shooting player? Who was involved in assisting for those shot attempts? Find out below.
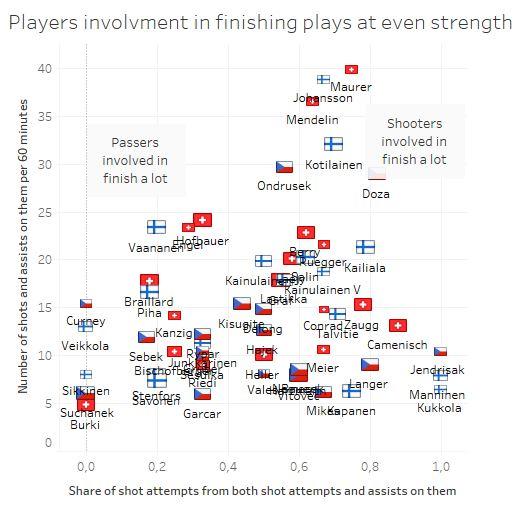
Vertical axis counts shot attempts and assists on them for players and recalculates it per 60 minutes of even strength time. Maurer (SUI) was the most active player involved in finish. His flag is viewed rather small meaning he did not play many minutes (thus smaller sample size), in fact he played only against Finland. Kotilainen (FIN) can be therefore awarded the most frequent finisher prize when we include only players with more significant time played. Also players closer to the left sife of the graph are those who are rather assisting on shot attempts than shooting themselves.
At the end I viewed clear path opportunities and odd man rushes for all players.
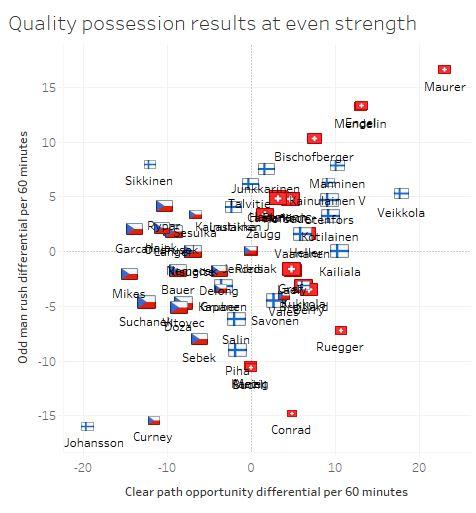
You might see a correlation yourself. Those who have positive results on one axis are more likely to be positive on the other one. There are some exceptions too. Let´s just end with praising Maurer (SUI) again but with a big warning of super small sample size. More interestingly we can see that all Swiss players were able to record neutral or positive clear path opportunity differential. For the Czech team some players had positive differential of odd man rushes.
One last very important notice here. Performance of each player depends heavily on the context he is put into. This context includes quality of teammates (possible to measure but was not done here), quality of opponents (same), score differential (not used here) and possible some others.
News
1 - 20 / 146


WFC 2018 in facts and figures – 10.1.2019
Data Analysis: WFC Summary – 12.12.2018
Data Analysis: WFC Summary – 12.12.2018
Data Analysis: Finland vs Sweden 6:3 – 12.12.2018
Data Analysis: Sweden vs Switzerland 5:4 ps. – 11.12.2018
Data Analysis: Czechia vs Switzerland 2-4 – 11.12.2018
Final Day of WFC: Gold Goes to Finland, Silver to Sweden, Switzerland Takes Bronze, Czechs Again without Medal – 9.12.2018
Pascal Meier is the MVP of WFC 2018 – 9.12.2018
WFC 2018 All Star Team – 9.12.2018
Finland Beats Sweden 6:3 to Defend World Champions Title – 9.12.2018
Switzerland Overcomes Czech Republic to Win Bronze Medals – 9.12.2018
Another spectator record broken! – 9.12.2018
Data Analysis: Czech Republic vs Finland 2-7 – 9.12.2018
Latvia Beats Germany to Earn 5th Spot – 9.12.2018
Norway Again Outplays Denmark to Finish in 7th Place – 9.12.2018
DAY 9: Grand Finale Is Here! New Champions to Be Crowned Today! – 9.12.2018
Day 8 Summary: Sweden and Finland in Final Again, Switzerland and Czech Republic to Play for Bronze – 9.12.2018
Sweden Becomes Second Finalist after Thrilling Shoot-out Win – 8.12.2018
Finland Defeats Czech Republic Thanks to Brilliant Scoring Efficiency – 8.12.2018
Germany Beats Denmark 4-2 to Fight for 5th Place Tomorrow – 8.12.2018